
A forecasting feature is easy to demonstrate on a neat sales chart. A small shop's history is rarely neat. A product may be new, a promotion may have caused a spike, and a week with no sales may mean the shelf was empty rather than demand was absent. The decision is not whether AI can draw a forecast. It is whether the forecast helps the owner place a better replenishment order than a simple rule.
Define the order decision
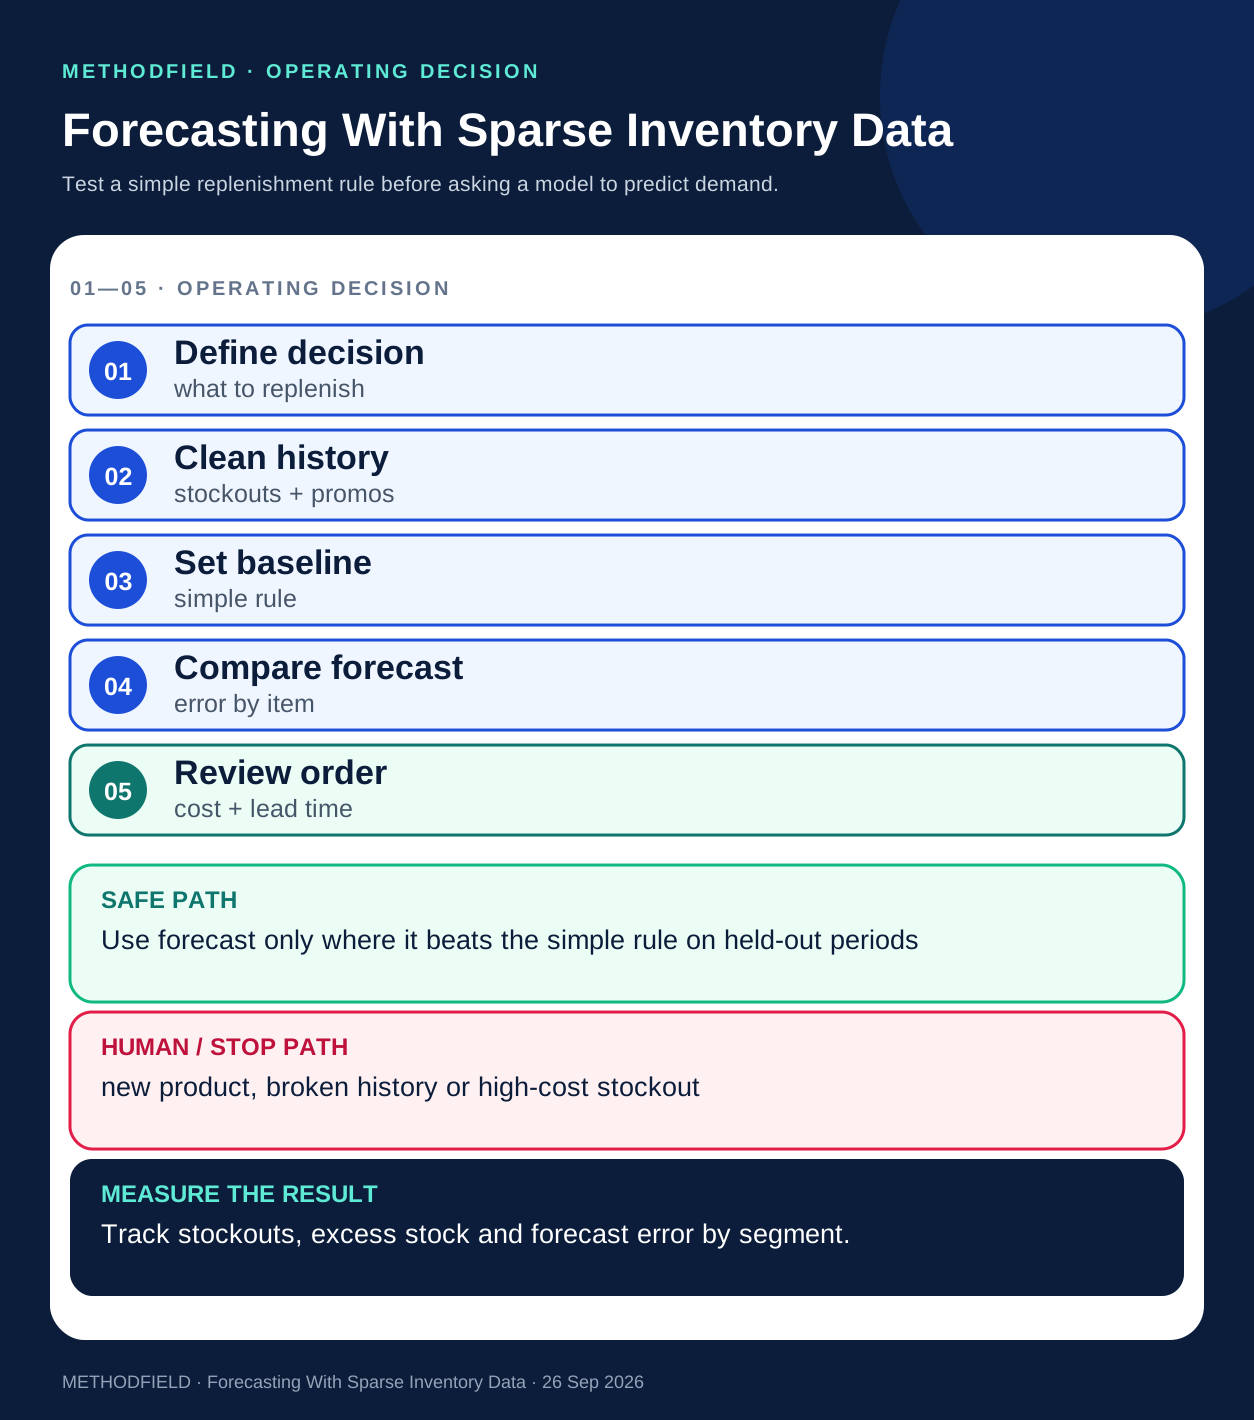
Choose one product group, one order cycle and one supplier lead time. Record current on-hand stock, incoming units, minimum order size, shelf life where relevant and the cost of both shortage and excess. A forecast without this context cannot tell the business what to buy.
First construct a simple baseline: for example, recent typical weekly sales adjusted for known closures and a stated buffer. Document every adjustment. Then compare a candidate model against that baseline on later periods it did not see. Do not let the model train on the same period used to declare it better.
Repair the demand history
Separate observed sales from demand. Mark stockout days, promotions, unusual opening hours, bulk orders and product substitutions. If the shop sold zero units because it had zero stock, treating that day as zero demand teaches the model the wrong pattern. If a new product has only three weeks of data, use a comparable product or a cautious manual rule rather than pretending the history is sufficient.
AI may help classify unusual events from notes or propose forecast segments. A spreadsheet or inventory system should calculate stock positions and enforce order constraints. The owner reviews unusually large orders and products where a mistake is expensive.
A worked decision
A small retailer restocks coffee filters every Monday. Its usual rule orders the last four weeks' typical demand plus a buffer. A new model suggests a larger order because the preceding week was strong. The buyer checks the event log and finds a one-off promotion. The model's number is not accepted until it performs better on later comparable weeks. If the supplier lead time has lengthened, the buyer may still increase the order—but that is a supply decision, not proof that the forecast is accurate.
What to measure
Evaluate by product group: forecast error on held-out periods, stockout days, excess stock, expired or discounted units, emergency orders and working capital tied up. Review both average performance and the worst costly misses. A model that reduces average error but repeatedly misses the shop's highest-margin item may be a poor operating choice.
Begin in shadow mode and record both the simple-rule and model recommendation at every reorder decision. Run long enough to observe the relevant supplier lead time and several comparable cycles; one order cannot establish an improvement. Let the buyer decide, record the reason and compare realised stockouts, excess and review effort. Continue only if the additional method changes decisions in a useful, explainable way.
The Methodfield AI case library includes a vendor-published inventory-planning example. It reports faster preparation but does not quantify forecast accuracy or financial impact. This article turns that evidence gap into a local test rather than assuming the case will transfer.
Working artifact: the reorder comparison sheet
Use one row per product and decision date. Keep the two proposed orders visible until the later outcome can be observed.
| Field | What to record |
|---|---|
| Stock position | On-hand units, committed units and confirmed inbound stock |
| Context | Supplier lead time, promotion, closure, stockout and substitution flags |
| Baseline | Simple-rule demand estimate, buffer and proposed quantity |
| Candidate | Model estimate, uncertainty, proposed quantity and version |
| Outcome | Buyer choice, reason, later shortage, excess and correction cost |
Compare decisions on the same dates and constraints. A model can have lower numerical forecast error yet recommend an order the shop cannot place because of pack size or shelf life. Record that operational failure separately from prediction error.
Sources and scope
- Methodfield: inventory-related cases and evidence limits.
- Methodfield: Prioritise the Workflow Before You Choose the AI.
The retailer example is illustrative. Forecast and savings claims require a real baseline and a later-period comparison.